To carry out this task, I have decided to select topic 3 that is uploaded to the Virtual Campus. This topic is related to statistics.
To make my activity more complete, I have not only summarized the topic, but I have decided to take it more to the didactic side. In my task we can find didactic contents, contents collected in the law regarding statistics in primary education, activities, challenges, videos ...
In my opinion it is a task that is done in a very pleasant way, since it is not the typical job of looking for information. In tasks in this case creativity is valued and not content, which I personally like.
I attach the link of my homework so you can see it.
https://create.piktochart.com/output/45234834-untitled-infographic
Measuring on the web
sábado, 4 de abril de 2020
Didactic´s App
My weight annotations
 It allows you to control or track your weight (actually we are talking about mass). You can customize the reminders to fit your plan to weigh yourself. From the data you are entering, make graphs, show in green or red whether your mass has risen or fallen. In addition, it produces reports that you can convert to different document formats to be able to open it in other applications.
This application, which is designed for personal use, could be great for working on statistics and social measures. Because it allows you to create many profiles, you can create a record of all the students in the class on the same device. Regularly, we can weigh ourselves and write down our mass. Additionally, this assignment can be shared between the math teacher and the PE teacher. At the end of the course, a graph can be made on a large mural where the students' process is seen and reflection on the results and the healthy measures taken to be as close as possible to their ideal BMI is promoted.
Statistics PRO
It is focused on the area of statistics, it makes inferences of results on a population from one or more samples that we enter in the application.
 It allows obtaining the total sum of the sampling, as well as the Mean, Median, Fashion, Hope, Variance and the Standard Deviation.
The PRO version has a new probability module, which is based on a number, between 0 and 1, which indicates the possibilities it has to verify when carrying out a random experiment.
In the third cycle of primary we can carry out our own statistical investigations and write them down in this application to analyze the data.
Also, the teacher can differentiate several groups and ask each one a question, for example: In an urn there are 3 white balls, 5 red balls and 4 black balls. Three balls are drawn consecutively, without replacement. Calculate the probability that all three are red. First, they must work without the application and calculate the result themselves. Then they will check it in the application.
Arloon Geometry
 Great Augmented Reality application that allows you to see geometric bodies from all perspectives and also how their faces unfold in flat figures. It combines conceptual content (definitions and characteristics) with procedural content (application of formulas and calculation).
It is a resource that facilitates the construction of spatial imagination and the concepts of area and volume through visual perception.
The designers of the application recommend it for children from 11 years old. But it can be used at younger ages to learn the simplest geometric figures.
A treasure hunt could be carried out where the tracks with 2D figures and questions about polyhedra are placed in different places in the center. The students with a device and the application unfold the 3D polyhedra and solve the clues to take them to the final treasure.
Didactic´s App
Ruler
It is an application for Android mobile devices, very useful to work the measurement in class and also in our daily life. We can download it for free in the Play Store.
It has a simple and straightforward design. In the options we can calibrate the ruler so that its measurement is as accurate as possible. It allows to measure in centimeters and inches.
You can take advantage of this resource in several ways, for example:
1. We can work on the idea that the measuring instrument can give different measurements when it is not calibrated. This can happen to us with other instruments that we use in the future. For this we can choose an object from the class and each student, or in small groups, measures with a different tablet. Then the measurements obtained are compared and the median will be chosen.
2. Using a physical ruler, we place it on top of the tablet to calibrate it, and thus make exact measurements.
3. Measure different objects in the classroom, for this the students must know that this rule is used to measure straight lines, for curved lines we will need another instrument that adapts to them.
4. Present the activity of measuring household objects, for this they will have to install the application on a personal device of the child or the parents.
5. Measure the growth of a plant that they are cultivating in the class. To do this, a systematic record of growth will be carried out through regular measurements.


Virtual classes
Due to the situation that we are living because of COVID19, from now on, classes, both in this subject and in others, will be online.
In these classes the teacher will focus on explaining the topics that are uploaded to the Virtual Campus and on solving the doubts that the students have.
The first virtual class was on March 26 at 9:45 a.m. In this session the teacher explained topic 3, Statistics. During the class, the students were able to ask questions about how the development of the subject would continue.
Our main question is the exam, since knowing that we cannot return to classes, we want to know how the exam will be organized. There is still nothing clear, since many factors are involved in this decision.
We also asked quite a lot about the tasks that have to be uploaded to the Campus, such as the task with Piktochart and the Blog. The teacher solved all our doubts, since we were not very clear about these tasks.
The second virtual class was on April 2 at 11 in the morning. In this class there were more difficulties, since most of the students could not enter the chat, where I included myself. Despite many attempts, the server would not allow me to enter the conversation and I gave up. I asked the Whastapp group in the class some questions and they were resolved.
We have not yet clear how we are going to continue with our learning, but there are teachers who are getting quite involved in solving doubts and reassuring us, which we appreciate.
sábado, 21 de marzo de 2020
Didactic´s App
Geogebra-Geometry
GeoGebra is dynamic mathematics software for all levels of education that brings together geometry, algebra, spreadsheets, graphing, statistics and calculus in one easy-to-use package.
This app is a quickly expanding community of millions of users located in just about every country. In our case, we are going to focus on Geogebra-Geometry, the part of the application that is responsible for performing geometry operations.
With this app students are able to create constructions with points, lines, circles, polygons, and angles; explore interactive geometry by dragging points; measure lengths and areas; transform shapes by mirroring, rotating and dilating them; try advanced constructions with conics and locus lines; investigate construction steps to get deeper understanding.
In addition, learners can search and investigate other applications to contribute to their mathematical development directly from this app. However, the most interesting aspect of this application is that students can save their projects and share their results with others.
Finally, this free app is compatible with both the Android operating system and iOS.
Tools for measuring time
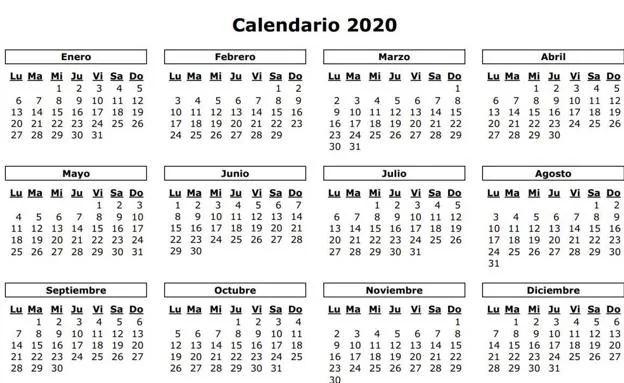
- Calendar: it is a systematized account of time for the organization of human activities, it allows us to have an exact measurement of the year in month and days.

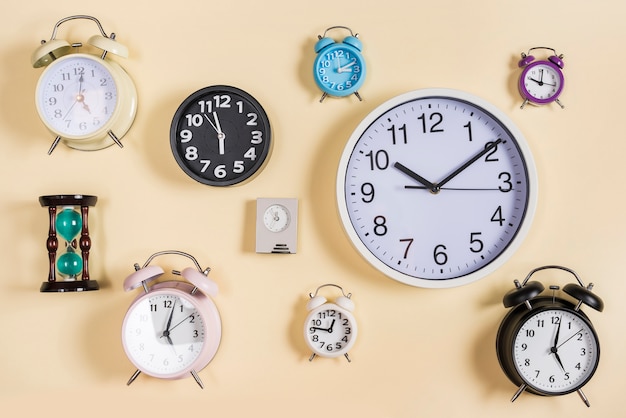
- Clock: it is an instrument that allows us to measure the passage of time in years, hours, minutes and seconds. There are a variety of watches such as sundials, hourglasses, analogue, digital, among others.

- Stopwatch: it is an instrument used to measure fractions of time, normally short and with great precision, seconds, thousandths of seconds, etc.

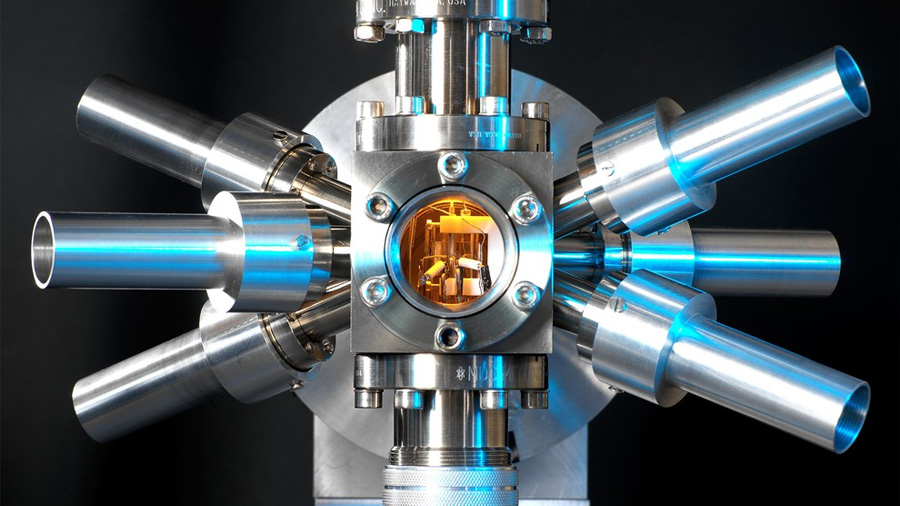
- Atomic Clock: A clock whose operation is based on the frequency of an atomic vibration. It is a type of clock that uses a normal atomic resonance frequency to power its counter.
- Radiometric Dating: is the technical procedure used to determine the absolute age of rocks, minerals and organic remains. Allowing to know the exact age of minerals of up to 60,000 years.

viernes, 20 de marzo de 2020
Didactic´s Apps
3D Plomada
A peculiar and quite complex application for measuring distances, because it is like the old plumb line used to see if an object is aligned correctly, along with other utilities for measuring sizes, proportions, distances and volumes.
It works with the camera of the phone, you point at the object you want to measure and align and through some lines you can check this.
It is somewhat complex to use, but this is due to the function it performs, although with a little practice you will surely learn how to handle it.
This distance measurement app is only available for Android.
Suscribirse a:
Comentarios (Atom)

